oneLineSystemMon: Simple Geeklet that shows cpu, memory, disk and transferred network data
When working with Linux you may be used to have a system monitor on your desktop like Conky or its ancestor Torsmo. If you are on OS X then you might like to use GeekTool for this purpose.
I put together a script for GeekTool that fits my needs. It will show up as a single line of text on your desktop and shows the load of your CPU, memory, disk and the transferred data on your network interfaces. The output is:
CPU 4.87% - MEM 5179M - SSD 70% - LAN IN:0 Bytes OUT:0 Bytes - WIFI IN:101.531 MiB OUT:13.687 MiB
If you wonder about the green and red color… this is just for my personal convenience to be able to quickly distinguish incoming and outgoing data.
You need a small python script called valueToIeee1541String.py to show the transferred bytes of the network interfaces in human readable format - e.g. “1.804 GiB” instead of “1936614762”. You can get it from here https://github.com/jewirth/valueToIeee1541String. Please put in in ~/bin to make the geeklet work or edit the geeklet manually.
Download the Geeklet: https://github.com/jewirth/oneLineSystemMon
Geeklets are associated with GeekTool which should start automatically when opening a Geeklet.
GeekTool can handle much more nice stuff than printing one line from a shell script. Google for “Geeklets” and have fun.
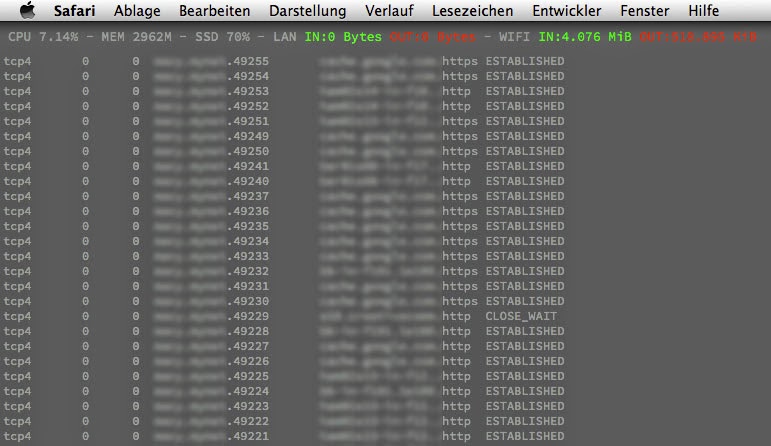
Update: I added a second Geeklet to my desktop directly below the above one. It shows the netstat output but only with certain socket states including ‘listening’. It’s too simple to provide a Geeklet file for this one. You just have to add a new Shell GeekLet with the following command in a single line:
netstat -a | grep -e ESTAB -e LIST -e CLOS -e SYN_ -e LAST_ -e _ACK -e FIN_ -e TIME_
This is how my two Geeklets will appear: